Simple App: a Linux toy application for user and kernel space

Figure 1 – Simple App architecture

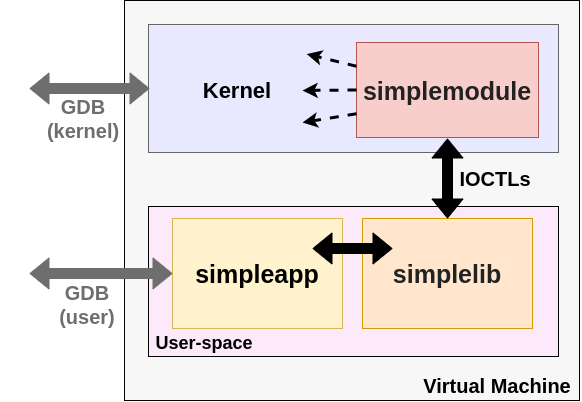
In the context of the Open Source Study Group, we decided to explore some Linux kernel APIs related to IPC and namespaces. An effective approach to this is exercising APIs from a crafted user-space application, while debugging at the kernel level. After some progress and setting breakpoints here and there, a challenge became evident: breakpoints in common functions are hit all the time from different processes. We need to filter out non-relevant hits, while staying focused on our application. This can be done, perhaps, by means of a conditional breakpoint in the debugger. Checking the binary image associated to the current task (looking into the mm_struct) should make it, but debugging complexity starts growing rapidly.

Continue reading “Simple App: a Linux toy application for user and kernel space”

GCC Signal Exceptions – Part 1

Fig. 1: proof-of-concept for handling segmentation fault signals in C as programmable exceptions

Signal Exceptions is a proof-of-concept extension to the C language with the goal of handling POSIX signals as programmable exceptions. This work is based on the GCC compiler and libgcc runtime for a Linux x86-64 platform. Only segmentation fault (SIGSEGV) signals are currently under the scope, but support for other signals can be added in the future using the same foundations. Source code and more documentation are available at end of this article.

With that said, I’ll briefly summarize some of the challenges and decisions taken while developing this project.

Continue reading “GCC Signal Exceptions – Part 1”

How terminal emulators work on Linux?

A few days back, while debugging the delivery of a SIGINT signal from the kernel to a foreground process, I wondered how terminal emulators work. In this article I’ll be using gnome-terminalbash and the yes application as an example; but the same concept should apply to any combination of a terminal emulator, a shell and a console application.

Gnome-terminal runs under a graphic environment (such as Xorg), so any key pressed on the keyboard has to turn into a character obtainable from there. Bash runs as a child process of gnome-terminal, and yes as child process of bash. Console application developers are used to reading input from STDINT and writing to STDOUT or STDERR. But, how are characters delivered from one end to the other?

Continue reading “How terminal emulators work on Linux?”

Global Descriptor Table (GDT) in Linux x86-64

Even though x86 memory segmentation is largely unused in 64 bits mode, the Linux kernel still initializes the CPU’s Global Descriptor Table (GDT) and points the gdt register to it. I was curious about its content and how segment selectors can be used today. This article is a brief summary of my experiments and findings.

To begin with, we can read the gdt register calling native_store_gdt in kernel space (arch/x86/include/asm/desc.h):

We see there that the register contains a virtual address, so segmentation is previous to pagination in protected mode.

Continue reading “Global Descriptor Table (GDT) in Linux x86-64”

Who prints “(core dumped)” after a segmentation fault?

When a CLI process in Linux exits after a segmentation fault, the following message is typically printed to stdout: “Segmentation fault (core dumped)”. We are assuming here that the process did not register a handler for the SIGSEGV signal. I was a bit curious about who was printing the message so started to dig a bit.

My first hypothesis was that libc had a default handler for this signal. After running the application with strace, I found no sys_write system call: the application and its libraries were not printing anything.

If a process registers no handler for SIGSEGV, do_coredump function (fs/coredump.c – Linux kernel) is executed. Caught my attention that the Kernel creates a new task and launches a user mode application. This application is /usr/libexec/abrt-hook-ccpp in Fedora, and the goal is to record and report the crash. I ran strings over its binary and dynamically linked libraries (libc, libreport, libabrt, etc.) but no clues.

Continue reading “Who prints “(core dumped)” after a segmentation fault?”

RPMs for Devs

There are times in which you want to rapidly set up a development and debugging environment for an open source project; without bothering with all the specifics, dependencies, build systems, installation, deployment scripts and so on. I found the Fedora RPM tools quite useful in this regard.

The idea is to leverage on leverage on the RPM tools, capable of instantly building thousands of projects from source code, but keeping intermediate artifacts as a development environment.

Continue reading “RPMs for Devs”

Debug Watchdog for Linux (v1.0)

Debug Watchdog for Linux (v1.0). Fedora 25.

Debug Watchdog for Linux (v1.0) is a new tool to monitor a Linux system and stop processes of chosen executable binaries immediately after launched. Once stopped, it’s possible to start a gdb debugging session right from the first instruction, as if gdb –wait-for-process exec.bin command existed. It may also be useful to analyze the process parameters and environmental variables. Code is open source, under a GPL license.

Every executable binary is caught: no matter how it was launched (command line, graphical user interface, ssh daemon, etc.), with which user or privileges nor how long it lives. This effectiveness is achieved patching the system calls table in kernel space and hooking sys_execve. Values are restored when Debug Watchdog is turned off. For obvious reasons, this tool is intended for non-production environments only.

Continue reading “Debug Watchdog for Linux (v1.0)”