Some noise to C1 JIT compiler for x86_64 (OpenJDK JVM – Hotspot)

Quarkslab folks proposed a challenge:  modify any compiler to generate code with some obfuscation but valid semantics. In other words, add some noise but keep the program logic valid.

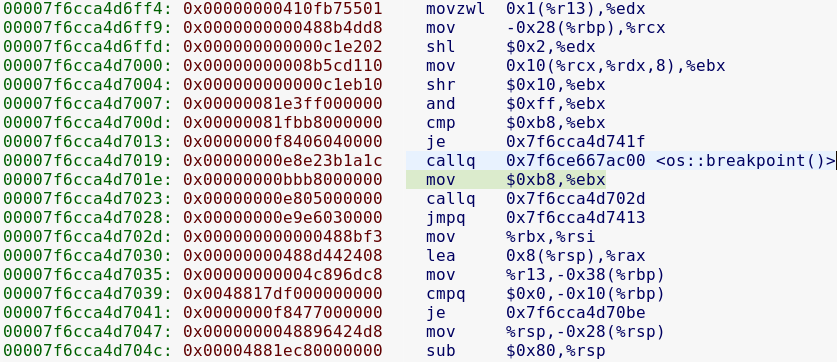
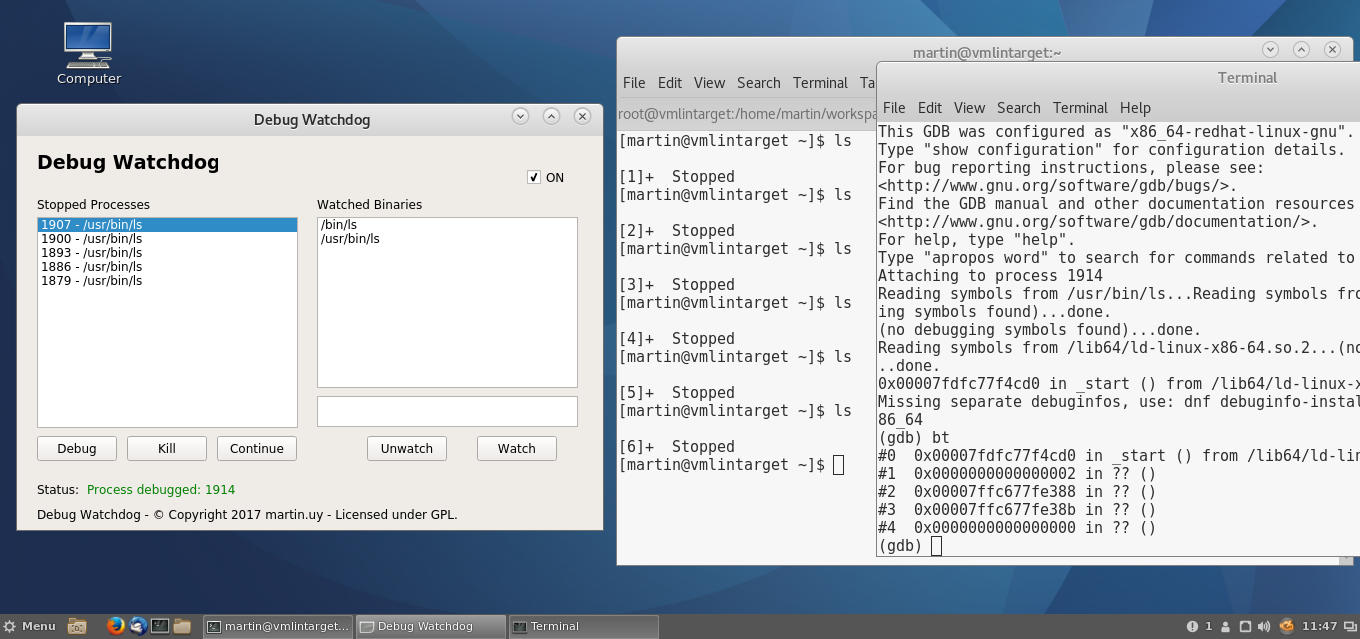
Time to have some fun with C1: OpenJDK’s 1st tier JIT compiler.

Obfuscation “noise” can be added at different stages of the compilation process. Adding it early may be useful to target multiple architectures but it’s necessary to check if following optimization passes revert the effect.

Continue reading “Some noise to C1 JIT compiler for x86_64 (OpenJDK JVM – Hotspot)”

Simple Patching Tool v1.0 (OpenJDK)

When writing OpenJDK tests in Java, I sometimes need to mock methods or set specific values on static fields in order to execute the paths of my interest. Even though using internal APIs is not ideal from a dependencies point of view, there is sometimes no choice. In example, a test that only uses public APIs may not be reliable enough to trigger a race condition bug; or may not return a constant value which can be compared against an expected one.

A few weeks ago I had to modify java.net.DatagramSocket default constructor to use a fixed port number, instead of getting a random one from the OS. Instrumenting Java bytecode with ASM was a good option back then. However, some modifications require more logic and implementing it with ASM can be harsh.

Continue reading “Simple Patching Tool v1.0 (OpenJDK)”

How to debug JIT compiled methods in OpenJDK JVM?

In the previous article we explored a couple of strategies to debug the OpenJDK JVM bytecodes interpreter. I will now present a procedure to debug JIT compiled code.

There are some JVM arguments useful to get information about JIT compiled methods:

Note: +PrintAssembly argument can be used to disassemble compiled code but requires a plugin library called hsdis in some JDK releases such as 8. In hotspot/src/share/tools/hsdis directory you will find the plugin code. To build it, open a command line and run:

Once built, copy build/linux-amd64/hsdis-amd64.so library to jre/lib/amd64 and jre/lib/amd64/server directories.

Continue reading “How to debug JIT compiled methods in OpenJDK JVM?”

Debugging the OpenJDK JVM interpreter in Linux x86_64

Debugging the CPython VM interpreter is not different than any C application: you attach or launch with a debugger, set a breakpoint in the opcodes interpreter main loop and that’s all. Doing the same in the OpenJDK JVM is not as straight forward: the x86_64 interpreter is a collection of assembly chunks generated in run time.

Simplifying the process, a set of C++ functions -whose names look like pseudo-assembly- is used to generate a stream of architecture instructions. These instructions, allocated in executable memory, are the bytecodes interpreter. There are entry points from the interpreter to C++ functions, intended for more complex and slow-path operations.

Continue reading “Debugging the OpenJDK JVM interpreter in Linux x86_64”

Debug Watchdog for Linux (v1.0)

Debug Watchdog for Linux (v1.0). Fedora 25.

Debug Watchdog for Linux (v1.0) is a new tool to monitor a Linux system and stop processes of chosen executable binaries immediately after launched. Once stopped, it’s possible to start a gdb debugging session right from the first instruction, as if gdb –wait-for-process exec.bin command existed. It may also be useful to analyze the process parameters and environmental variables. Code is open source, under a GPL license.

Every executable binary is caught: no matter how it was launched (command line, graphical user interface, ssh daemon, etc.), with which user or privileges nor how long it lives. This effectiveness is achieved patching the system calls table in kernel space and hooking sys_execve. Values are restored when Debug Watchdog is turned off. For obvious reasons, this tool is intended for non-production environments only.

Continue reading “Debug Watchdog for Linux (v1.0)”