Debugging the CPython VM interpreter is not different than any C application: you attach or launch with a debugger, set a breakpoint in the opcodes interpreter main loop and that’s all. Doing the same in the OpenJDK JVM is not as straight forward: the x86_64 interpreter is a collection of assembly chunks generated in run time.
Simplifying the process, a set of C++ functions -whose names look like pseudo-assembly- is used to generate a stream of architecture instructions. These instructions, allocated in executable memory, are the bytecodes interpreter. There are entry points from the interpreter to C++ functions, intended for more complex and slow-path operations.
As an example, let’s see how the JVM interpreter code is generated to handle method invocation bytecodes.
Java:
|
1 2 3 4 5 6 7 8 |
public class Main { public static void main(String[] args) { m(); } public static int m() { return 1; } } |
Bytecodes:
|
1 2 3 4 5 |
public static void main(java.lang.String[]); Code: 0: invokestatic #2 // Method m:()I 3: pop 4: return |
TemplateTable::resolve_cache_and_index (templateTable_x86_64.cpp) is used to generate instruction streams capable of handling different method invocation bytecodes (invokestatic, invokevirtual, invokeinterface, etc.). These streams will be part of the interpreter. Let me stress the difference between the C++ generator code -executed a few times only- and the generated instructions which will handle the actual bytecodes -executed once per Java method invocation, assuming there are no JIT compilers-.
In resolve_cache_and_index generated code, the first thing is to determine if the method was previously resolved. If it was not, a call to the JVM is done for a heavier and one-time-only resolution. See InterpreterRuntime::resolve_invoke (interpreterRuntime.cpp).
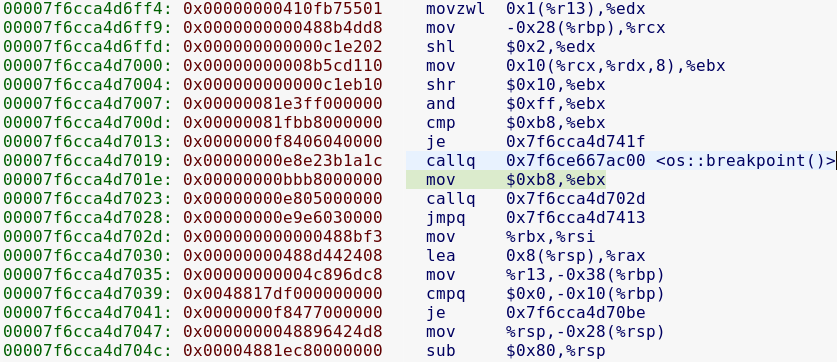
Let’s say that we want to debug the interpreter -not the interpreter generator, which would be as easy as setting a breakpoint in C++ code-. One strategy we can apply is running the JVM with -XX:+PrintInterpreter parameter and breaking at the end of TemplateInterpreter::initialize (templateInterpreter.cpp). In stdout you will find the virtual address for every interpreter chunk. The interpreter is just generated and no Java bytecode has been processed yet. Before continuing execution you can set a breakpoint in the chunk of interest.
Stdout:
|
1 2 3 4 5 6 |
... ---------------------------------------------------------------------- invokestatic 184 invokestatic [0x00007fffe104bb00, 0x00007fffe104bfc0] 1216 bytes ... |
Setting the breakpoint in invokestatic interpreter chunk:
|
1 |
(gdb) break *0x00007fffe104bb00 |
Once the invokestatic interpreter chunk gets called:
|
1 2 3 4 5 6 7 8 9 10 11 12 13 |
Thread 2 "java" hit Breakpoint 4, 0x00007fffe104bb00 in ?? () (gdb) x/10i $pc => 0x7fffe104bb00: push %rax 0x7fffe104bb01: jmpq 0x7fffe104bb30 0x7fffe104bb06: sub $0x8,%rsp 0x7fffe104bb0a: vmovss %xmm0,(%rsp) 0x7fffe104bb0f: jmpq 0x7fffe104bb30 0x7fffe104bb14: sub $0x10,%rsp 0x7fffe104bb18: vmovsd %xmm0,(%rsp) 0x7fffe104bb1d: jmpq 0x7fffe104bb30 0x7fffe104bb22: sub $0x10,%rsp 0x7fffe104bb26: mov %rax,(%rsp) ... |
Setting the breakpoint at the beginning of the interpreter chunk can be inconvenient if only an internal point is of interest. If recompiling the JVM is not a problem, we can modify the interpreter generator and inject, in the point of interest, a call to MacroAssembler::os_breakpoint (macroAssembler_x86_64.cpp). The generated interpreter code will call os::breakpoint C++ function in run time and we can set an ordinary gdb breakpoint there to catch execution.