In part #3 of the CHA series we found that the callsite to I::m in Main::j2, generated by C1, was initially unresolved. In this article we will describe how the JVM locates the symbolic information attached to this callsite and, taking the receiver object into consideration, finds the actual method to be invoked: A1::m.
|
1 2 3 4 5 6 7 8 |
public static void j2(I i) throws Throwable { i.m(); } public static void main(String[] args) throws Throwable { ... j2(new A1()); } |
Callsite symbolic information
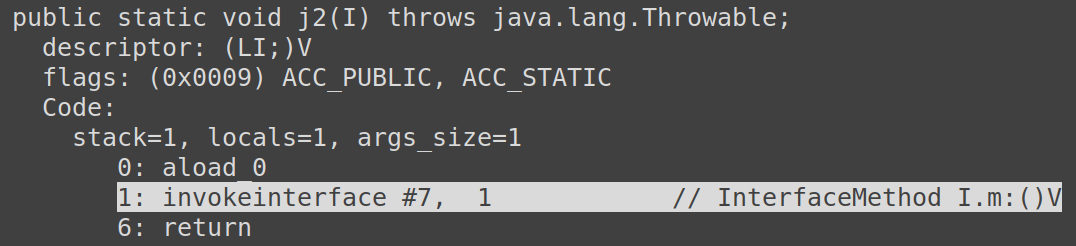
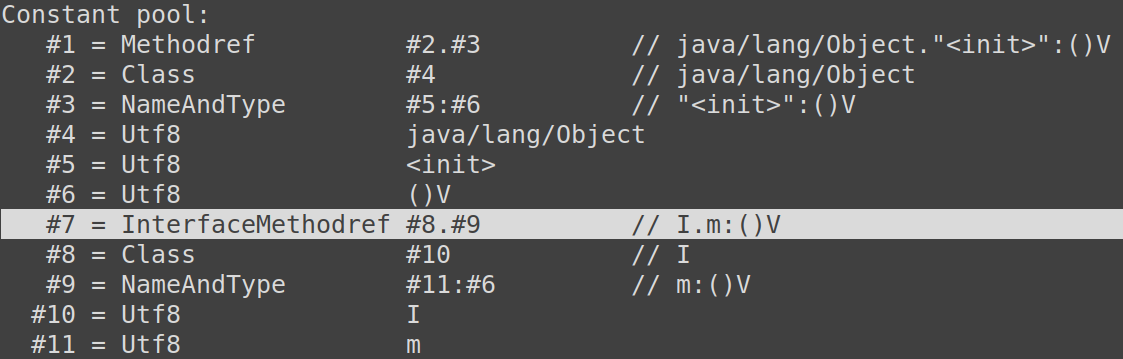
By symbolic information we mean strings referring to the name of the method, its holder class or interface and its signature. This information, generated by javac, is available both in the Constant Pool of a classfile and in the metadata area of the JVM once the class is loaded. Every bytecode of the invoke type has a reference to one of these Constant Pool entries. In our I::m example this entry is of the InterfaceMethodRef type and can be linked by means of the number #7.
invokeinterface bytecode at I::m‘s callsite:
Symbolic information attached to the previous callsite:
It’s now clear that the invocation is to a method called m, that belongs to an interface called I and its signature is ()V —takes no arguments and returns void—. Resolution will initially tell the JVM object (instance of the Method class) that corresponds to such method, but can later go further by dynamically analyzing the receiver object.
Callsites are resolved lazily, during execution. If the method were first executed by the JVM interpreter, the bci (bytecode index) would be known and could be used as a starting point to get the symbolic information attached. However, the method was compiled by C1 in our example and getting the bci is more involved.
C1-generated code for the unresolved callsite (x86-64):
|
1 2 3 4 5 6 7 8 |
[Verified Entry Point] # {method} {0x00007f5da08002d0} 'j2' '(LI;)V' in 'Main' ... 0x7f5db4e0b7cd: movabs $0xffffffffffffffff,%rax 0x7f5db4e0b7d7: callq 0x7fffe56a3f20 ; ImmutableOopMap {} ; *invokeinterface m ; {virtual_call} ... |
Let’s see what happens once execution hits the unresolved callsite. We start with a call to 0x7fffe56a3f20. What we have at this address is a code blob —an assembly list of instructions— generated by SharedRuntime::generate_resolve_blob, and represented at the JVM level by an instance of RuntimeStub. The goal of this code is to invoke C++’s SharedRuntime::resolve_virtual_call_C(JavaThread*) in the JVM, leaving the Java-execution state temporarily. To accomplish so, this code adds its own frame to the call stack, saves the registers to the stack, saves the stack pointer and calls the target method:
|
1 2 3 4 5 6 7 8 9 |
0x7fffe56a3f20: push %rbp 0x7fffe56a3f21: mov %rsp,%rbp ... 0x7fffe56a3f30: mov %rax,0x78(%rsp) 0x7fffe56a3f35: mov %rcx,0x70(%rsp) ... 0x7fffe56a3f8c: mov %rsp,0x2d8(%r15) 0x7fffe56a3f93: mov %r15,%rdi 0x7fffe56a3f96: callq 0x7ffff6cc9c4e <SharedRuntime::resolve_virtual_call_C(JavaThread*)> |
Every thread that executes Java code is represented in the JVM by an instance of the JavaThread class. In x86-64 JIT-compiled methods, the R15 register points to the JavaThread instance of the thread in execution. When the thread is not in a Java-execution state, JavaThread‘s __anchor member has the value of the stack pointer before transitioning out, as well as the last program counter. This is the instruction that saved the stack pointer: mov %rsp,0x2d8(%r15). In x86-64, the program counter can be derived by reading the value in stack pointer - sizeof(void*) (return address).
Once in the JVM, execution moves to SharedRuntime::find_callee_info. The purpose of this method is both to fill a CallInfo structure with information about the callsite —we can think of this as a static resolution— and to return the receiver object Handle for a dynamic resolution.
To resolve a callsite statically, we first need to find the Java method where it is located. In our example, this would be the JVM’s Method instance representing Main::j2. With the JavaThread‘s __anchor we can build a frame instance for the top-most frame. See the last_frame method and its arch-specific pd_last_frame counterpart. A frame instance represents a physical stack frame of a C or Java method (compiled or interpreted). We have seen before that the frame previous to transitioning out of the Java-execution state belongs to a RuntimeStub code blob. Thus, its sender frame must be Main::j2.
To navigate from one frame to its sender, we first need to locate the code blob —represented in the JVM as an instance of CodeBlob— that generated it. If we take the anchor‘s program counter and pass it to CodeCache::find_blob_unsafe(void*), we get the CodeBlob that we are looking for. Adding the ClodeBlob‘s frame size to the anchor‘s stack pointer will get us to the sender’s stack pointer before its call. The same process can be repeated to build its frame instance and finally get Main::j2‘s CodeBlob.
We said that the RuntimeStub‘s sender must be the Main::j2 method, but there is a caveat here: Main::j2 could have been inlined as part of a larger compilation unit. Thus, there isn’t necessarily a 1 to 1 relationship between compiled and Java methods: a single physical frame can map to many frames at the Java source level, and a single CodeBlob can map to many Java methods. To handle this complexity, a wrapping structure called vframeStream is built out of a frame. This structure provides a convenient way to navigate Java source frames, which are called virtual frames and represented by the vframe class.
To initialize a vframeStream instance, the frame at the top of the call stack is used. If this frame does not represent a Java method, its sender will be considered. In our example, RuntimeStub‘s frame is skipped and Main::j2‘s frame chosen. vframeStreamCommon::fill_from_frame is the key function in initialization. This function takes the frame‘s program counter and retrieves its corresponding PcDesc instance. A PcDesc instance is part of the compiled method’s metadata and maps a program counter to a source scope.
This is how the frame, CodeBlob and PcDesc instances looks like for the I::m callsite in Main::j2:
|
1 2 3 4 5 6 7 8 9 10 11 12 13 14 15 16 |
(gdb) print _frame {_sp = 0x7ffff58ab800, _pc = 0x7f5db4e0b7dc, _cb = 0x7fffe5603610, ...} (gdb) print *_frame->_cb (nmethod) {<CompiledMethod> = {<CodeBlob> = {... _type = compiler_c1, ... _code_begin = 0x7f5db4e0b7c0 ...}, _method = 0x7f5da08002d0, _scopes_data_begin = 0x7fffe56038b8, _pc_desc_container = {_pc_desc_cache = {_pc_descs = {0x7fffe56038f8, 0x7fffe56038d8, 0x7fffe56038e8, 0x7fffe56038c8}}},...} set $method = 0x7f5da08002d0 set $method_name = (**((Symbol**)((intptr_t*)(((char*)(((Method*)$method)->_constMethod->_constants)) + sizeof(ConstantPool)) + (((Method*)$method)->_constMethod->_name_index))))._body set $method_holder_name = ((Method*)$method)->_constMethod->_constants->_pool_holder->_name->_body x/s $method_holder_name 0x7ffff0180fe6: "Main" x/s $method_name 0x7ffff0180d56: "j2" (gdb) print *pc_desc {_pc_offset = 28, _scope_decode_offset = 10, _obj_decode_offset = 0, _flags = 0} |
The _pc member in the frame points to the instruction right after the 0x7f5db4e0b7d7 call in the unresolved callsite. The CodeBlob associated to the frame shows that the compiled method is Main::j2: there was no inlining in this case. We can also see different PcDesc instances attached to the CodeBlob. In particular, the one associated to the callsite indicates that the program counter 0x7f5db4e0b7dc (offset 28 within the compiled method, which can be added to _code_begin for an absolute address) maps to a source scope located at offset 10 (which can be added to _scopes_data_begin for an absolute address). The source scope data can be interpreted by means of a DebugInfoReadStream. Methods read_method and read_bci are the most relevant for our purposes. This is how the scope data and the returned Method and bci values look like:
|
1 2 3 4 5 6 7 8 9 |
(gdb) x/21xb ((CompiledMethod*)_frame._cb)->_scopes_data_begin 0x7fffe56038b8: 0xff 0x00 0x01 0x01 0x00 0x00 0x00 0x01 0x7fffe56038c0: 0x00 0x00 0x00 0x01 0x02 (gdb) print this->_method (Method *) 0x7f5da08002d0 (gdb) print this->_bci 0x1 |
I won’t get into how the source scope data information is encoded, but the Method data is at 0x7fffe56038c3 in the previous bytes stream (value 0x1) and the bci is at 0x7fffe56038c4 (value 0x2). Decoded values are saved as vframeStream fields in vframeStreamCommon::fill_from_compiled_frame. First, we see the _method value printed —remember from the previous dumps how 0x7f5da08002d0 is Main::j2—. Second, we see the _bci —remember from the previous classfile’s disassembly how the bytecode at index 0x1 in Main::j2 is the invokeinterface we were looking for—.
In summary, we statically translated an unresolved callsite in a C1 compiled method to its Java bytecode level instruction and, therefore, have its symbolic information available in the Constants Pool.
Receiver object information
SharedRuntime::find_callee_info is also responsible for finding the receiver object at the callsite, and delegates this task to a helper: SharedRuntime::find_callee_info_helper. First, Main::j2‘s frame is obtained here and then frame::retrieve_receiver invoked. I will give an overall idea of what happens next, without getting into details. There is an OopMap structure associated to the callsite (part of the compiled method’s metadata) that indicates where in memory are oops —pointers to Java objects— located at that point of execution. Notice that oops can reside in the method’s stack frame or could have been in a callee-saved register that was later pushed into the stack —some collaboration from the callee is needed in the latter case—. From all oops, we are interested in the one that, by calling convention, happens to be parameter 0. For advance readers, parameter 0 is a VMReg that we can identify and look up in a RegisterMap built out of OopMaps.
Actual resolution
With the symbolic information about the callsite and the actual receiver object, LinkResolver::resolve_invokeinterface is invoked. The following dump shows information aggregated in a LinkInfo instance inside this method:
|
1 2 3 4 5 6 7 8 9 10 11 |
(gdb) x/s ((LinkInfo*)0x7ffff5819f10)->_name->_body 0x8004be556: "m" (gdb) x/s ((LinkInfo*)0x7ffff5819f10)->_resolved_klass->_name->_body 0x8004b32f6: "I" (gdb) x/s ((LinkInfo*)0x7ffff5819f10)->_signature->_body 0x8004b3156: "()V" (gdb) x/s ((LinkInfo*)0x7ffff5819f10)->_current_klass->_name->_body 0x7ffff0167566: "Main" |
Notice that _name and _signature are symbols, whereas _resolved_klass and _current_klass have been resolved to actual klass instances.
Additionally, the receiver’s object class is stored in a separated local variable:
|
1 2 |
(gdb) x/s recvrKlass->_name->_body 0x7ffff0167536: "A1" |
With this information in hand, LinkResolver::resolve_interface_method is invoked to continue the work. I will leave to the reader the task of investigating classes hierarchy navigation, but can tell that a handle to the H::m Method instance will be returned. Notice here that the interface I inherits the method m from H‘s declaration, and that’s why we don’t have a I::m Method instance.
With H::m resolved, LinkResolver::runtime_resolve_interface_method is invoked. In this invocation, resolved_method is a handle to H::m, resolved_klass is I and recv_klass is A1. Without getting into details, what happens next is a hierarchical search for a concrete method called m, starting at the receiver object’s class. The A1::m Method instance will be found at the end of this search.
As a result of the resolution, CallInfo has the following information:
|
1 2 3 4 5 6 7 8 9 10 11 12 13 14 15 16 17 18 19 20 21 22 23 24 |
(gdb) x/s ((CallInfo*)(0x7ffff581c8b0))->_resolved_klass->_name->_body 0x8004b32f6: "I" (gdb) set $method = ((CallInfo*)(0x7ffff581c8b0))->_resolved_method._value (gdb) set $method_name = (**((Symbol**)((intptr_t*)(((char*)(((Method*)$method)->_constMethod->_constants)) + sizeof(ConstantPool)) + (((Method*)$method)->_constMethod->_name_index))))._body (gdb) set $method_holder_name = ((Method*)$method)->_constMethod->_constants->_pool_holder->_name->_body (gdb) x/s $method_holder_name 0x80062004e: "H" (gdb) x/s $method_name 0x8004be556: "m" (gdb) set $method = ((CallInfo*)(0x7ffff581c8b0))->_selected_method._value (gdb) set $method_name = (**((Symbol**)((intptr_t*)(((char*)(((Method*)$method)->_constMethod->_constants)) + sizeof(ConstantPool)) + (((Method*)$method)->_constMethod->_name_index))))._body (gdb) set $method_holder_name = ((Method*)$method)->_constMethod->_constants->_pool_holder->_name->_body (gdb) x/s $method_holder_name 0x7ffff0167536: "A1" (gdb) x/s $method_name 0x8004be556: "m" (gdb) print ((CallInfo*)(0x7ffff581c8b0))->_call_kind $7 = CallInfo::itable_call (gdb) print ((CallInfo*)(0x7ffff581c8b0))->_call_index $8 = 0 |
Modified callsite in Main::j2 after resolution:
|
1 2 3 4 |
... 0x7f5db4e0b7cd: movabs $0x801000400,%rax 0x7f5db4e0b7d7: callq 0x7fffe55f9800 ... |
|
1 2 |
(gdb) x/s ((Klass*)0x801000400)->_name->_body 0x7ffff0167536: "A1" |
Finally, the unresolved callsite in Main::j2 is patched with a jump to the unverified entry of the resolved method A1::m (0x7fffe55f9800). Notice that is different than using the itable entry number in the receiver object’s I itable to get the method. The callsite is still virtual but an optimization called inline caching was applied. The strategy is to jump to the most likely concrete method but, immediately after, checking that the receiver object is an instance of the expected class —A1 in our example, available in RAX—. If the receiver object were not such instance, a slow-path branch in the code can handle a new search (see SharedRuntime::handle_wrong_method_ic_miss).